Tuesday, May 6, 2014

Day 7 - A Teacher's Perspective - Communicating via Email

Day 7 - A Teacher's Perspective - Communicating via Email

In Day 6 of the Aspen 21 Day Challenge we learned how to export the data we discovered in a query based on the field set view. The previous 6 days have been about organizing the data, and digging deeper into the analysis. In today's blog we'll explore how to use some of the communication tools built into Aspen to share information with our students and anyone connected to them (parents or other teachers). Day 7 will focus on the email tool from a teacher's perspective. Aspen has a very easy, but powerful email tool to contact students, parental/guardian contacts, and any other teacher connected to the student.

Accessing the Email Tools in Aspen

You can access the email tool in Aspen in multiple ways. You can use the Email tool directly from the Teacher Classes widget, or from the Student top tab using the Options tool. 

The Teacher Classes' widget can be accessed from the Pages top tab in Aspen. In fact, it should be the landing page that is displayed once you log on to Aspen. Illustration 1 displays the Teacher Classes widget on the landing page.
Illustration 1: Teacher Landing Page
From the teacher landing page simply click on the email icon connected to the students in a specific course. Once you click on the email icon you will be presented with the Mass Email dialog box. Once the Mass Email dialog box is displayed you will have several options before you send your email. You can choose to send the email to students, their contacts, and their teachers. Simply use the selection tick boxes to add or remove groups from your email. You can also click the X icon to the right of each recipient to delete them from the list. Illustration 2 depicts the email dialog box.
Illustration 2: Mass Email Dialog Box

Once you click the send button you are presented with a dialog box asking you if you are sure you want to send your email. Click the yes button to send your email. You can also access the same process from your student list using the Student top tab in Aspen. From the Student top tab click the Options menu item and drag to Send Email. The Mass Email Dialog box will appear, and you can use the directions from above to send your email. Illustration 3 shows the send email process using the Options menu item.
Illustration 3: Using the Options Send Email Process
The send email tool in Aspen is very easy to use, but one of those hidden gems that most teachers and administrators don't realize is at their disposal. In future blog posts we'll dig deeper into the Pages tool in Aspen as a communication tool, and an integral component of the Aspen.


Sunday, May 4, 2014

Day 6 - Exporting Your Query

Day 6 - Exporting Your Data From A Query

In Day 5 of the Aspen 21 Day Challenge we learned how to use the data we queried in a quick chart. In today's blog we'll explore how to run a query based on our district's NECAP assessment, export that data into a CSV (comma separated value) file, and then upload into Google Spreadsheets. For today's example I'm interested in looking at the data of the 4th graders in a specific school. I want to run a query that locates the students in each of the homerooms within a specific school. Essentially my query looks into the student table within the Homeroom Teacher field for a specific teacher's name. My query looks like this: Student>Homeroom Teacher Contains XXXX (XXXX is the teacher's last name). If I write my query correctly and include each of the teachers' names in a particular school I should get all of the students for those teachers in my results.

My Query & the Results

Once I run my query I am left with a list of 58 students representing the 4th graders that took the NECAP assessment in that one school. This information matches my knowledge about the school, and the actual number of students that took the October 2013 NECAP assessment. I do want the data in a spreadsheet form so I can manipulate it easily using multiple variables, but I also want to create a quick chart on the information that I queried. See Day 5 if you want specific directions on how to create a quick chart. My quick chart request is displayed in Illustration 1.
Illustration 1: Creating a Bar Chart of Reading Levels by Homeroom Teacher
The quick chart that I would like to view will pull the students' reading achievement level (Read AL field) from the assessment definition history table, and the homeroom teacher's name (Homeroom teacher field) from the student table. This information will be displayed in a standard bar chart depicting the reading achievement levels across each teacher's classroom. Although NECAP assessment data isn't the only data point we use for student placement it is helpful to use it for some general information. In this use case scenario we can take a quick look at the students and use it for a discussion around student placement. Illustration 2 displays each teacher's data according to NECAP reading achievement level from the October 2013 assessment.
Illustration 2: Student NECAP Reading Achievement Level by Homeroom Teacher
Seeing this data as a classroom teacher, building level administrator or central office administrator just piques my interest, and makes me want to dig deeper. At this point I think I would like to export the data concerning these students, and manipulate the data using Google Spreadsheets. Of course, whatever I am illustrating using Google Spreadsheets can be done in Open Office's Sheets, Microsoft's Excel, or any other spreadsheet tool.

Exporting the Data into a CSV

Exporting the data from Aspen into a CSV is a simple and quick process. Whatever is showing in the data field set is what will be exported into the CSV file. If you want to change the field set view to add or reduce fields for your export you can refer back to Day 3 of "The 21 Day Aspen Challenge". Once your field set view is all set simply click on the printer icon located to the top, right-hand side of your browser window. Illustration 3 shows the icon.
Illustration 3: Exporting to CSV
Once you've clicked on the printer icon drag to CSV to export your field set view into a CSV formatted document. Aspen will create a csv formatted file, and will most likely download the file to your downloaded files folder. Since I'm using a Chromebook the Chrome browser automatically downloads the file into my File Manager. Illustration 4 displays the Aspen generated CSV file. 
Illustration 4: Chromebook File Manager

Importing the CSV File into Google Spreadsheets

The WWPS uses Chrome as our supported browser, and many of our staff use Chromebooks as their school department computer. The following set of instructions illustrates how to import the CSV file into Google Spreadsheets. WWPS users should go to their Google Drive, and select the folder where they would like to import the file. I have a subfolder labeled 2013-2014 NECAP Data that sits within a larger Data folder. I am going to import or upload the QR_677307155347372458.csv file into the 2013-2014 NECAP Data folder. The QR_XXXXX file name is automatically generated by Aspen and refers to a Quick Report file. Illustration 5 shows the initial steps to upload the file into your Google Drive. 
Illustration 5: Import CSV into Selected Google Drive Folder

Once you've clicked the Upload Files option you will need to locate the CSV. In this example I am locating the QR_677307155347372458.csv file within my Download Manager on my Chromebook. Illustration 6 displays that process. 
Illustration 6: The 3 Step CSV to Google Spreadsheet Process

Once you've finished the 3 Step CSV to Google Spreadsheet process you'll be able to open your exported data in Google Spreadsheet for further analysis and sharing. Illustration 7 displays the data in a Google Spreadsheet. If you would like to know more about using Google Drive. You can view Paul Barrette's 21 Day Google Drive Challenge
Illustration 7: Reviewing the Data in Google Spreadsheets

The Final Word

Exporting your field set data into a CSV file is extremely powerful tool within Aspen. I hope that Day 5 of the 21 Day Aspen Challenge is helpful to you as a teacher, administrator or support personnel. Let me know what you'd like me to dig deeper into regarding exporting data from Aspen.

Thursday, May 1, 2014

Day 5 - Using the Data You've Queried in a Quick Chart

Day 5 - Using the Data You've Queried

In Day 4 of the Aspen 21 Day Challenge we learned about queries and how to create them to ask questions about your data. Once you've located the data, and answered your questions there are some simple tools that you can use within Aspen. One of my favorite tools in Aspen is the Quick Chart tool. The quick chart tool allows you to create a quick graph of the data you've collected from your query. Illustration 1 displays how to start the process.
Illustration 1: Create Quick Chart
Once you've selected the type of chart you want to create you will need to determine which field you want to use to display in your graph. You can also name the chart title that will be displayed. Illustration 2 shows an example of what can be done to display the NECAP reading achievement levels in a pie chart.


Illustration 2: NECAP Pie Chart
The pie chart created will be made available as a PDF document that can be saved to print, or shared with others. Illustration 3 is an example of the Reading NECAP data for the 2013-14 school year.
Illustration 3: NECAP Reading Data
 It's a simple tool, but extremely useful. In the next blog post I'll explore how to export data that you've queried, and how to open the data in a Google spreadsheet.


Wednesday, April 30, 2014

Day 4 - Queries, Queries Everywhere!

Day 4 - Queries, Queries  Everywhere!

In day 3 of the Aspen 21 Day Challenge we learned about field sets and how to create them to display the data according to the fields we wanted to view. Once you begin to get a deeper understanding of the fields in Aspen you'll want to be able to dig deeper. Your answer is the query tool in Aspen. A query is simply your ability to ask a question of the data. It sounds simple enough, but whenever you ask a data system a question you have to know what you're asking for, and how to ask the question. Initially the process may drive you batty, but stick with it. The benefits of learning how to query your data in Aspen will outweigh the initial frustration of creating a query and getting zero results displayed. Again stick with it, and soon you'll be making your data sing!

The Query Tool: Dissecting the Options

Before we get into the "how tos" about running a query lets take a look at the options for running queries. The first step is to know where to find the query tool.  You can run a query from most of the top tabs, and side tabs in Aspen. Simply click on a top tab, in illustration 1 I've selected the student top tab from the district view. Once you've selected a top tab click on the Options menu item, and drag to the Query tool. This is where the magic starts ;)
Illustration 1: How to Locate the Query Option

The 3 Different Query Modes: Simple, Advanced & SQL

You can run one of three different types of query modes in Aspen. The Simple Mode is the easiest query mode to use in Aspen, and what appears as the default. The Advance Mode, and the SQL Mode are used by end users that have more experience with the query tool. It's an easy jump from the simple mode to the advanced mode, but the SQL mode takes an understanding of SQL. Illustration 2 displays each of the query modes.
Illustration 2: Query Modes in Aspen
For our purposes in today's blog we'll discuss the simple mode query tool. In future blogs we'll explore the advanced mode, and the direct SQL mode. The simple mode query tool is quite powerful, and relatively easy to use if you understand some basic information about your data.

Conceptual Ideas connected to queries

●A query in Aspen is connected to your knowledge of field sets..
●A query asks for information pulled from fields that are located within tables.
●A query can pull (or ask for) information from more than one table.
●A query can be simple or complex. You can create a series of simple queries, or one more
complicated question.
●The information collected from a query can be collected in a field set that can be exported to
Google Docs or Excel using the CSV exporter tool.

Step 1: Start Off With A Question

The best place to start with queries is to figure out what question you want to answer using your data. In my example I want to quickly identify the students in my class that scored less than a 2 on the State of RI's standardized assessment, Mathematics NECAP. For the purposes of this example I'll be searching for that data in the Staff View of Aspen. You can refer back to Day 1 of the 21 Day Aspen Challenge for more information on Aspen views. I need to know some information, and know what specific question I want to ask. I would like to ask the following question using the simple mode query in Aspen.  
  • Which students scored a 2 or less on their mathematics achievement level on the 2013-14 NECAP assessment? 
In order for me to ask that question successfully I need to understand that there are several questions built into one question. There are actually three questions, or three pieces of information that I need to know before I can ask the right question in my query. I really need to know the following:
  1. What is the NAME of the assessment definition. Assessment definitions are where we keep the different assessment data in Aspen. It's how we categorize one assessment from another, such as NECAP vs. PALs.
  2. What was the DATE range of when the assessment took place. Sometimes it's easier to think about that as did the date of the assessment take place on or after a certain date.
  3. What is the name of the specific data FIELD that you're trying to get to in your query. This is why it's important to have an understanding of your data dictionary in Aspen. 
Thinking about queries in this manner will help your significantly in your quest to become the master of your data. 

Step 2: Understand Your Data Dictionary

To answer my question,  "Which students scored a 2 or less on their mathematics achievement level on the 2013-14 NECAP assessment?", I need to know some information about my data dictionary. It would be helpful to visit the data table using the top tabs and side tabs in Aspen. Essentially every time you click on a top tab or a side tab you are accessing a data table in the system. To better understand the assessment definition data table I will go to the district view, click on the assessment top tab, click the assessment definition side tab, and finally locate the NECAP assessment definition details. Illustration 4 displays the many field that can be queried using the simple mode query in Aspen. Remember we want to query information about the DATE, the NAME, and the MATHEMATICS ACHIEVEMENT LEVEL.
Illustration 4: Assessment Definition Details
All of the fields that are collected in a specific assessment definition can be displayed in a field set within Aspen. The field set view is what allows you as a teacher or administrator an easier representation of the data. In the WWPS we actually import our assessment data in two steps. The first step pulls the data into Aspen and allows us to view it or query against it from the fields illustrated in illustration 4. This is great because our data is now in a system where we can run multiple queries against it, but the view isn't very helpful. We take the data, and reimport it into fields that most teachers and administrators want to access. That information shows up in the field set view in the Assessment History side tab. Once the information is displayed in that manner it allows us to see it, and query it in a much simpler way. Illustration 5 shows assessment data, and how it can be displayed in a field set within the Assessment History side tab.

Illustration 5: Understanding Field Names & Data Tables

Step 3: Putting the Query Together

Now that we have a better understanding of where the assessment data is housed, and the fields that contain the bits of data from one NECAP assessment we're ready to run our query. If we think back to our original question we want to find the students in our classes that scored a 2 or below on the October 2013 NECAP assessment. Our question was:
  • Which students scored a 2 or less on their mathematics achievement level on the 2013-14 NECAP assessment? 
To ask that question we would click on the student top tab from our staff view. Once our students were listed we could click on the Options menu and drag to the Query tool. Once the New Query popup displayed we could begin to ask the three separate questions that make up our query. Before we go further let's understand the six parts that make up our query. See Illustration 6 to get a break down on each part of a query.
Illustration 6: Query Dissected
My first task is to get to the right table for my query. I want to access the information from the Student Assessments table. I do that by clicking on the triangle from the tables field, and scroll to Student Assessments. Illustration 7 shows how to select the Student Assessments table.
Illustration 7: Choose the Correct Table

Once I've chosen the correct table, I can begin to ask the right questions concerning the fields in the data table. Again I'm going to refer to my original question to ensure that I build the query in the correct manner.
  • Which students scored a 2 or less on their mathematics achievement level on the 2013-14 NECAP assessment? 
I'm going to start out by building my query on the assessment definition name. We established earlier that I had an assessment definition called NECAP. My query needs to identify the correct assessment. I want to make sure that delineate between NECAP, PALs, Grade Score or Local Assessments. That query ends up looking like the following statement: Student Assessments > Assessment Definition > Name Contains NECAP. I ended up choosing the CONTAINS operator, because it's more forgiving than the equals or exactly matches operators. Once I've asked my first question, I can build on my query and ask my next question. I want to check on NECAP scores for the 2013-2014 school year so I need to make sure I ask the right question. For this query I asked the following: AND Student Assessments > Date On or After 9/1/2013. I used the AND button because I wanted to create a logical progression that included the first question and the second question. I also used the ON OR AFTER operator to let Aspen know that I wanted information concerning NECAP after the start of this particular school year. I'm ready to ask my third and final question which is: AND Student Assessments > Math AL Less than or equal to 2.0.  In this final question I used the and operator again to tell Aspen that I wanted all of the information from the first two questions and this final question in the same search. Essentially Aspen is looking in the Math AL field for scores of 2.0 or less. Illustration 8 displays the final query.
Illustration 8: Your Finished Query

Once you've finished writing your query you can click on the search button. Your results based on the question you asked will be displayed in your present field set. Once you have your results you can export the data as a CSV to import into Google Spreadsheets, create a quick chart or print out your data. We'll explore ways to export and view the data within upcoming blogs on the 21 Day Aspen Challenge. Make sure you comment on the blog to let me know what questions you'd like answered.

Saturday, April 26, 2014

Day 3 - The Power of Field Sets

Day 3 - The Power of Field Sets

In Day 2 we learned about the power of the data stored in the Staff View of Aspen. The key to using Aspen effectively is setting it up so it makes sense to you as an end user. One of the hidden gems that I use all of the time, but few people change is the "Field Sets" tool. This tool allows you to organize your data in a manner that makes sense to you, and meets your needs. It's really the tool that allows the end user to see the data in a spreadsheet view that makes the most sense for the specific job at hand. Field sets used in conjunction with queries, and quick charts are a powerful trio that will allow you to get a lot of use from Aspen. You can always use the Aspen Online Help Tool for additional helpful information.

Just What is a Field Set Anyway?


A field set is how data is displayed within columns in Aspen. It is the spreadsheet look of how your data is displayed. The columns are displayed in a default view, but Aspen also allows you to create your view. This flexible tool has some major benefits to end users. The more you change field sets to meet your needs the more you understand the underlying data structure of the information in your Aspen instance. This understanding will benefit you greatly once you begin using the query tool.

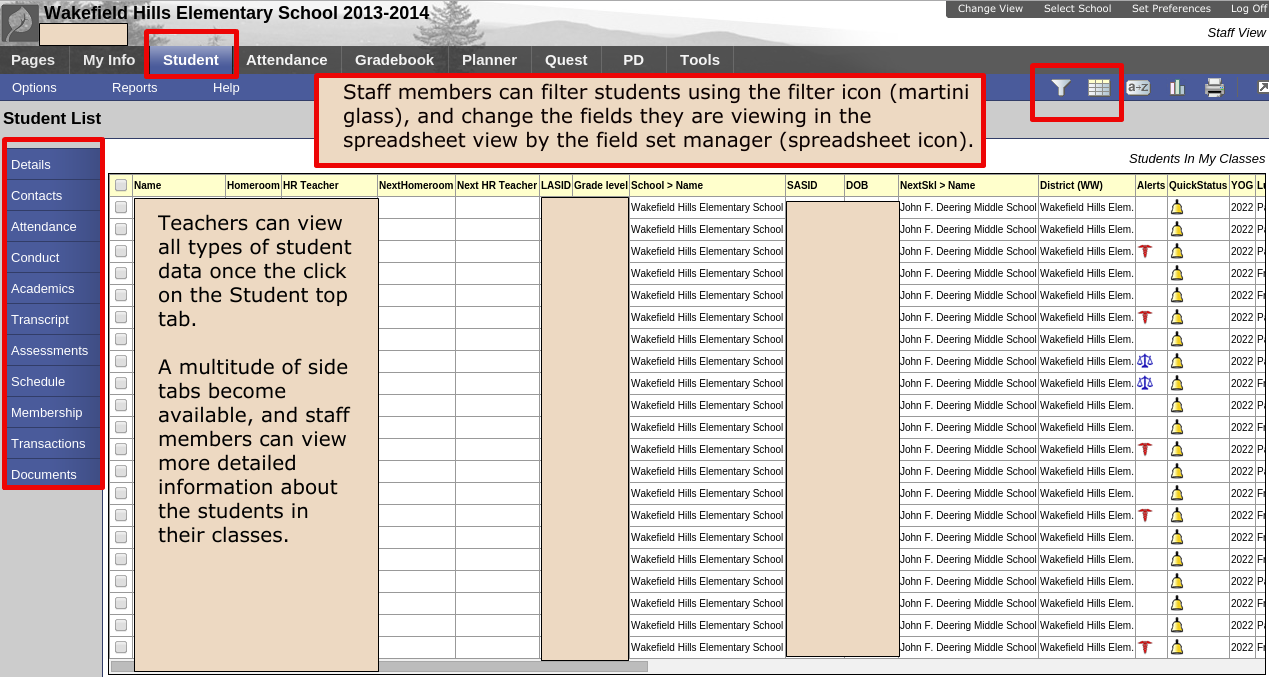
Illustration 1: The Spreadsheet View of Field Sets

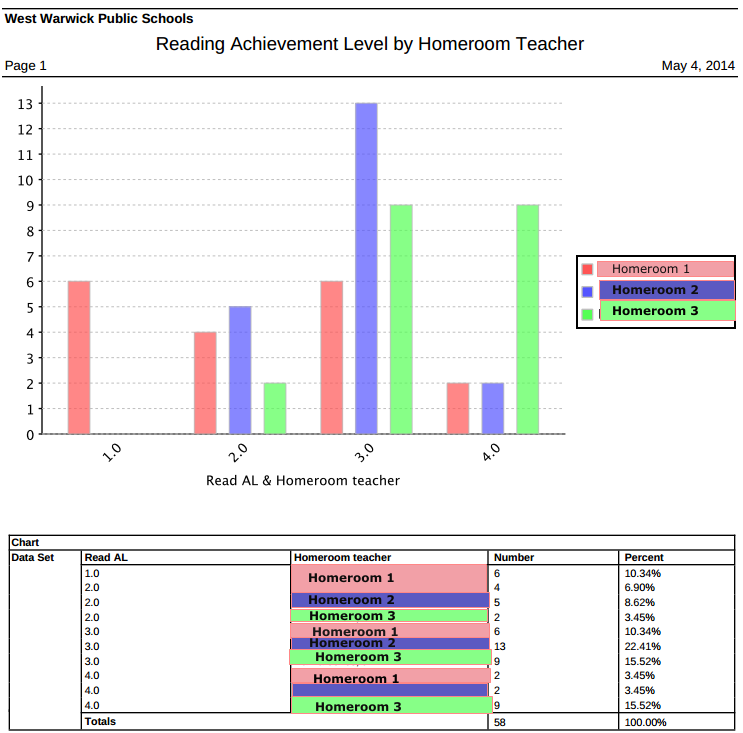
In illustration 1 the fields that we're viewing can be found in the curriculum maps, and the curriculum document structure tables. I'll break down the tables and the fields found within the tables a little later in this blog.

Where Can I Find the Field Set Tool?


Users can find the Field Sets Menu tool whenever the access any of the data tables in Aspen. Once you click on a table heading (commonly known as a top tab in "Aspenspeak") several options become available, and the field set menu is bundled with a group of tools located in the far, right-hand corner of your browser window. The field set icon is depicted in the screen capture below.

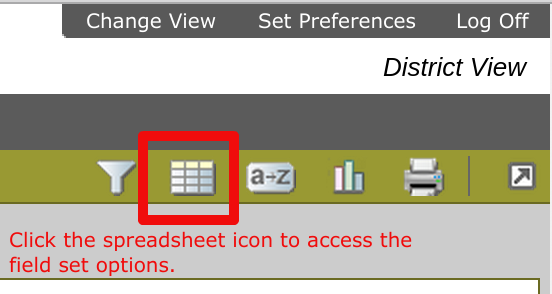
Illustration 2: Field Set Icon

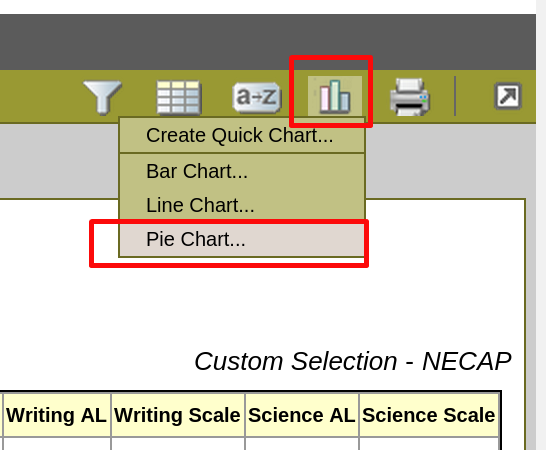
Clicking the field set option will allow you access to multiple options. You will be able to select from existing field sets (many of these options may have already been created by district staff and shared with everyone in the organization) or manage your field sets. Selecting between the existing field sets will just change your present view to the selected view. This option allows you to make quick changes in how your data is displayed from saved view (or field set) options. 

If you choose the manage field set option you will be able to show/hide, create, edit, copy or delete existing field sets. You will only be able to edit or delete field sets that you own or have access rights to for editing or deletion purposes. Some field sets are system or district field sets, and you won't be able to edit or delete. However you can copy the field set, and then make changes to it to suit your purposes.

Illustration 3: Add, Copy Edit Field Sets


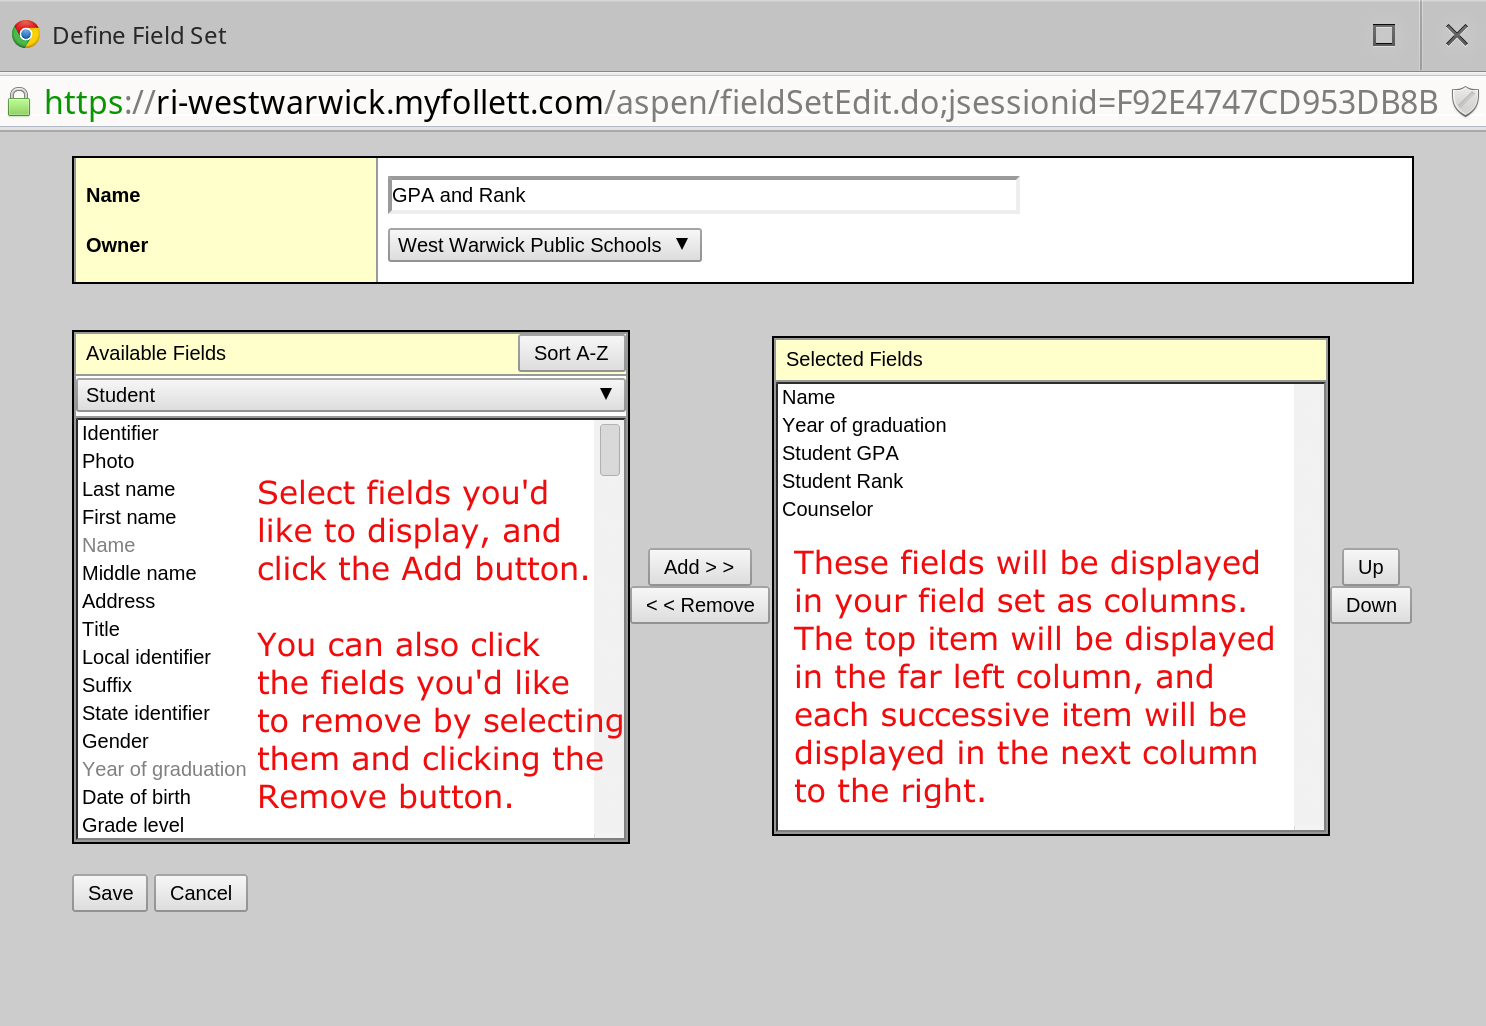
The main purpose of using field sets is that the end user can determine exactly how much or how little data they want to view in a particular field set. Depending on the purpose for viewing the data the end user may want to include vast amounts of data displayed in columns according to each field in the database tables, or very specific sets of data that is uncluttered by other fields or columns. In the image below I just wanted to view data concerning our student's Grade Point Average (GPA) and their class ranking. I created a field set that is uncluttered, and contains 5 fields from the student table.

Illustration 4: Student Ranking & GPA Data
The illustration above depicts the concept that the end user gets to decide how much or how little data is displayed in a field set. Sometimes it is helpful to have a lot of data for analysis purposes, and sometimes it's helpful to have limited amounts of data, because you just want to create a list of students that meet a specific criteria. In the illustration depicted I wanted an ordered list of students by class rank with their GPA that could be easily shared with the appropriate adults in our organization. 

Create a Field Set to View GPA Data

To create this list I did the following:
  1. Click on the Field Set Icon, and select manage field set. 

  2. Select the Field Set You would like to edit (GPA and Rank), and click the edit button. In the case of the GPA and Rank (District) field set you cannot edit a field set you don't have the appropriate security settings to edit. If you want to edit a district field set you can always click on the copy option first. You can then edit the copied field set, because now you own the field set.


  3. Add and remove fields from the tables listed. The fields that are selected will determine what is displayed in the field set (or the spreadsheet) view. Important Note: The first field in your list will be the farthest most left column in your spreadsheet, and the last field in your list will be the farthest most right column.


  4. Click the Save button once you've made all of your changes to your field set. Remember you can always go back and edit an existing field set if you still need to make changes.

I am positive that once you learn how to use this simple, but powerful tool in Aspen you will find countless ways to use it to help analyze the data concerning your students. When you couple this tool with the ability to query the various data sets in Aspen you have a very powerful tool at your disposal. Use the comment tool in Blogger to let me know if you have any questions or requests about what I should write about in my next installation of "The Aspen 21 Day Challenge".

Friday, April 25, 2014

Day 2 - Digging Deeper into the Staff View

Day 2 - Digging Deeper into the Staff View

It amazes me how much information can be found in the staff view of Aspen. It also amazes me that so few of us actually know what information is available to us within the staff view. The staff view allows teachers and staff members quick access to data connected to their students, and data directly related to their personnel data.
Illustration 1: Staff View Overview

My Info Top Tab

Let's start out at the first top tab labelled My Info. The My Info top tab is a treasure trove of data regarding your employment in your school district. Most of the information that you'll find in the details side tab is a read-only view. Some districts may decide to use a workflow to update your basic demographic information on the person table.
Illustration 2: Staff Members Detail View

My Info Side Tabs

Staff members can also click down the left side tab to view their attendance data (historical and current year), their schedule, additional schools they may be associated with, license information, degrees, course work, PD Plans, their Positions, Extra-curricular Activities, Groups they belong to, Documents created, and Snapshots they are connected to. Each one of the side tabs listed above can contain additional more detailed information from the fields within the data table.

Student Top Tab

Of course, staff members spend most of their time with students, and there is a tremendous amount of data that teachers have access to concerning their students. Teachers can view the students details page, their contacts (detailed information), the student's attendance information (current year & historical), the student's conduct information (current year & historical), their academic summary information, their detailed transcript information, assessment data, their schedule, their membership (enrollment) information, transaction data (events, workflows, etc.), and documents connected to the student. The documents area is rich with student journal information, documents published, IEPs, Ed. Plans created (504s, RtI referrals), and forms. The forms manager allows us to manage any locally created forms associated with the student. This area usually contains a lot of useful information for the classroom teacher.
Illustration 3: Staff View - Student Top Tab

Attendance Top Tab

Teachers use the attendance top tab daily to take their classroom attendance, and record student lunch choice selections. There is also some very useful information within the Attendance side tabs that are less obvious to teachers. Teachers can take their classroom attendance, but they can also click on the trends side tab to view their students' attendance trends. This information can be helpful in alerting a teacher to any troubling trends for a specific student, or a group of students. Teachers can also take attendance by class under the Class side tab. This side tab provides the teacher with additional options to input daily class attendance, review trends by class, and review class seating charts. The seating charts option will be blogged in a later blog (most likely the blog about Gradebooks).

Illustration 4: Student Attendance Information

Gradebook Top Tab

You may have noticed a trend by now, that when you click on a top tab there is usually a breathtaking amount of options in the side tabs. The gradebook in Aspen is no different. When you click on the Gradebook top tab you will have access to the details for each class, the roster of the students in the class, the seating chart, student groups, curriculum maps associated with the class, the reporting standards associated with the class (standards-based report cards), the categories, the assignments, and the scores associated with a class. The gradebook top tab is so extensive that several future blogs will be dedicated to several specific areas of the gradebook.  

Planner Top Tab

The planner top tab is the place in Aspen that connects a teacher's event view, curriculum view and lesson view. Each of these views has its own special functions, and we will explore each of them in future blogs. The curriculum view is a very powerful aspect of Aspen, and is included in districts that have the Aspen IMS package. We will review the curriculum view from the aspect of the District view, and within the Planner top tab Staff view. In brief the Planner top tab is a very powerful and is quite useful for teachers. Teachers can view assignment information from the event view, and add their own lesson plans even without Aspen IMS. I'm actually excited about sharing some of the functionality of the planner top tab in a future blog.

Quest Top Tab

The Quest top tab is the place in Aspen that connects the teacher's ability to search for resources, and save them to their own or shared resources. The resources can be used in a teacher's lesson plan, or in curriculum maps. Quest is an important aspect of the curriculum and learning tools within Aspen IMS. Teachers can search and save resources from websites, One Search, digital resources and a district's Destiny (online catalog) resources. Quest allows a teacher to search a keyword or topic and retrieve the results from the web, One Search, digital resources (like Curriki), and Destiny. The Quest tools will be explained in greater detail when we jump into the curriculum tools in Aspen.
Illustration 5: Using the Quest Tools

PD Top Tab

The PD top tab in Aspen is the place where staff members can see district wide PD goals, district PD offerings, and serve as the administrator for any courses they are teaching. Staff members can request to join a PD activity within their PD top tab, and the Offerings side tab. 

Tools Top Tab

The tools top tab in Aspen is where staff members can view information about the grade scales used in their gradebooks, and standards-based reporting. Staff member can create and view special codes and footnotes for gradebook purposes. Footnotes are exactly what the name implies, a footnote concerning a specific grade in the gradebook. Teachers can use this tool to alert parents and students to extenuating circumstances surrounding a grade in the gradebook. The courses side tab allows teachers to view the courses that they teach, or the course that other teachers maybe teaching in their department. Teachers can dig deeper and view the standards being assessed within a specific course. The initiated workflows side tab is a little known, but powerful tool in Aspen. This too allows teachers and staff to view any workflows that they have initiated. In fact, it is probably the easiest way for teachers in our district to locate their latest educator evaluation workflow. One of the things that I love about Aspen is its high degree of transparency. The Logs side tab is a way for staff members to see who has been logging into their gradebook, and the reason why a system administrator has viewed their gradebook. Speaking of the gradebook, the Question Bank side tab is the online quiz tool connected to the assignment tool. When I dig deeper into the gradebook I'll dedicate some time and energy to the question bank, and online assignment tool.

Illustration 6: Tools Top Tab
The staff view has a lot of power built into it, and teachers and staff members can spend a lot of time learning about the ins and outs of the staff view. Please use the comment tool in my blog to let me know which tools you want me to dig deeper into over the next 21 days. Don't forget to use the online help tool built into Aspen to help answer some of the questions you may run into as you dig deeper. The online help tool is quite extensive and very helpful. Let me know where you want me to go next.


Wednesday, April 23, 2014

Day 1 - The Multiple Views of Aspen

Day 1 - The Multiple Views of Aspen

Aspen allows the end user to see multiple views within the Aspen Instructional Management System(IMS). The views that you're able to see depends on the security settings established by your system administrator. Aspen provides the following views:

  • District
  • School
  • Staff
  • Health
  • Build
  • Special Education
  • Personnel
  • Student
  • Family

The District View is primarily for system administrators, district support personnel or school department members that need to access data connected to the District View. In the WWPS teachers and administrators can access the District View to see district wide student assessment data, global data tables or curriculum mapping data. 


The School View contains all of the data connected to the members of a school. This data pertains to students, staff, and contacts within a particular school. In the WWPS all teachers, administrators and staff members have access to the school view. This data is used by School Improvement Teams (SIT) to make programmatic decisions about students and curriculum.  


The Staff View allows you to view information that pertains to you as a staff member. You can view a whole host of information under each of the top tabs associated with the Staff View. Staff members can view specific data that connects to the students in their schedule. In addition to the information associated with their students, staff members can view additional information pertaining to their personal information found in Aspen. Teachers and staff members can view their individual information regarding the details kept in their personnel record. Staff members can review their own schedule, their attendance history, licensure information, and a historical view of their positions.


The Health, Build, Special Education, and Personnel Views in Aspen are views that very few people in a district have access to due to the sensitive nature of most of the data found in those views. I'll most likely leave those views to a specialized blog in the future. 

The Family View in Aspen allows parents and guardians access to the Family Portal. Parents and guardian members can view information about students in their family. Individual student information about academics, discipline data, and attendance information can be viewed by parents and guardians in the Family Portal. Group pages are also accessible to adults via the Family Portal. Schools and teachers can share resources, and engage family members in discussion forums. It is a view in Aspen that has a lot of potential for growth. 


The Student View in Aspen allows students access to the Student Portal.  Individual student information about academics, discipline data, and attendance information can be viewed by students in the Student Portal. Students can also submit student work and artifacts in the Student Portal. Students also have access to Quest, Aspen's resource collection tool.


In future blogs I will dig deeper into each of the views listed here, and create some step by step instructions to help Aspen IMS users to dig deeper on their own. It is my hope that you find the blog posts helpful.