Day 6 - Exporting Your Data From A Query
In Day 5 of the Aspen 21 Day Challenge we learned how to use the data we queried in a quick chart. In today's blog we'll explore how to run a query based on our district's NECAP assessment, export that data into a CSV (comma separated value) file, and then upload into Google Spreadsheets. For today's example I'm interested in looking at the data of the 4th graders in a specific school. I want to run a query that locates the students in each of the homerooms within a specific school. Essentially my query looks into the student table within the Homeroom Teacher field for a specific teacher's name. My query looks like this: Student>Homeroom Teacher Contains XXXX (XXXX is the teacher's last name). If I write my query correctly and include each of the teachers' names in a particular school I should get all of the students for those teachers in my results.My Query & the Results
Once I run my query I am left with a list of 58 students representing the 4th graders that took the NECAP assessment in that one school. This information matches my knowledge about the school, and the actual number of students that took the October 2013 NECAP assessment. I do want the data in a spreadsheet form so I can manipulate it easily using multiple variables, but I also want to create a quick chart on the information that I queried. See Day 5 if you want specific directions on how to create a quick chart. My quick chart request is displayed in Illustration 1.
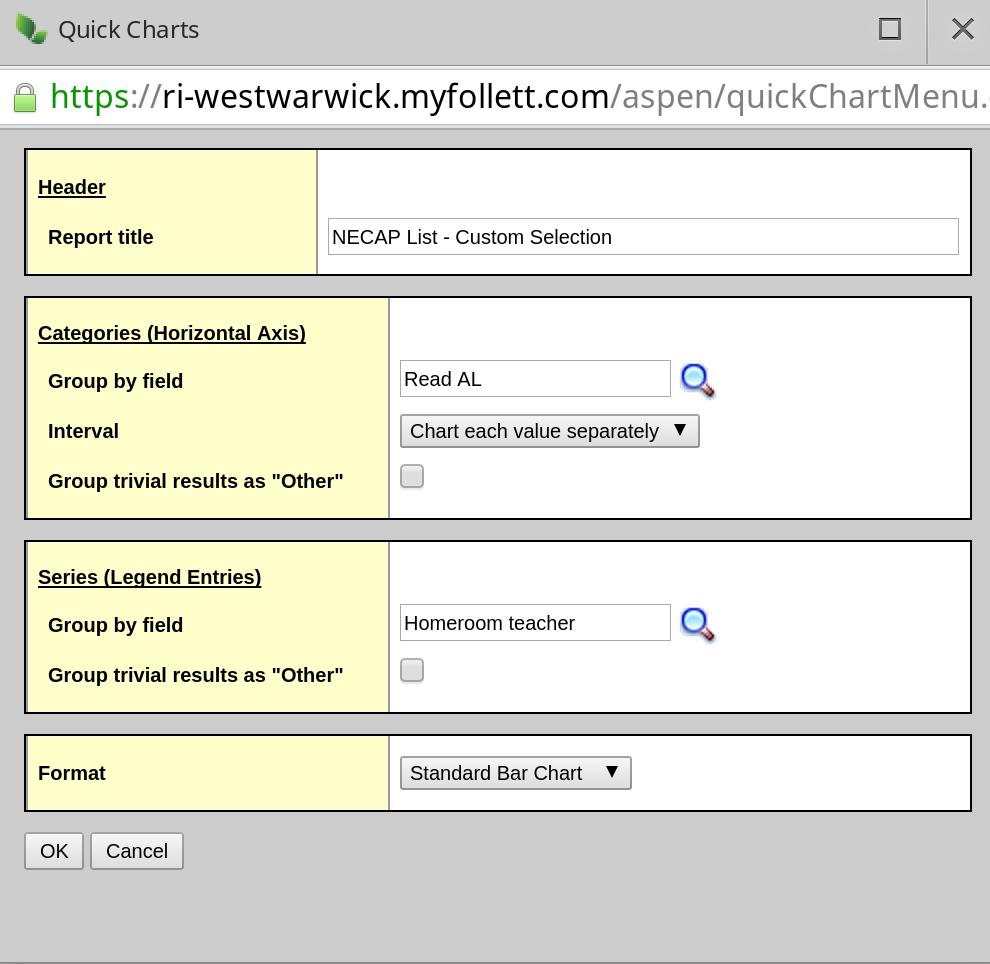 |
| Illustration 1: Creating a Bar Chart of Reading Levels by Homeroom Teacher |
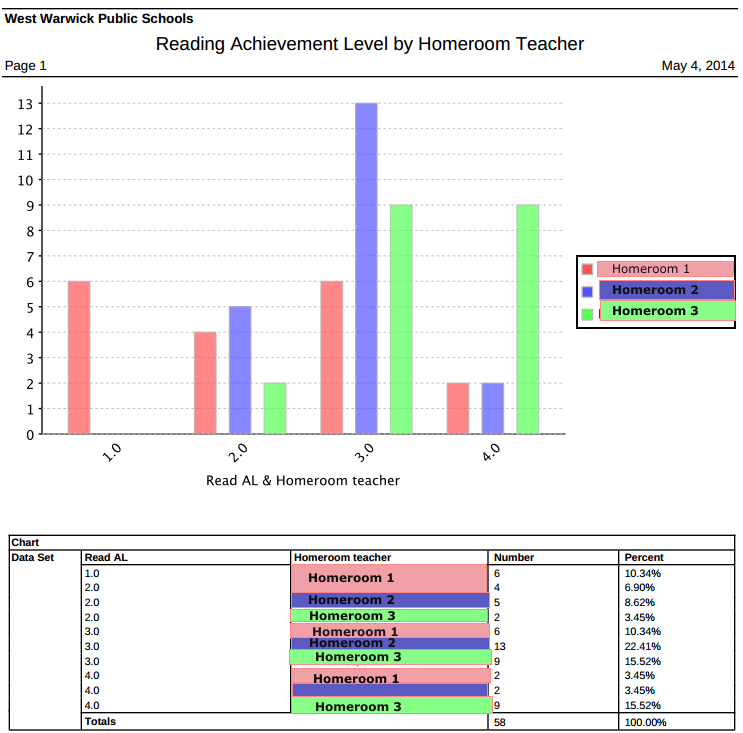 |
| Illustration 2: Student NECAP Reading Achievement Level by Homeroom Teacher |
Seeing this data as a classroom teacher, building level administrator or central office administrator just piques my interest, and makes me want to dig deeper. At this point I think I would like to export the data concerning these students, and manipulate the data using Google Spreadsheets. Of course, whatever I am illustrating using Google Spreadsheets can be done in Open Office's Sheets, Microsoft's Excel, or any other spreadsheet tool.
Exporting the Data into a CSV
Exporting the data from Aspen into a CSV is a simple and quick process. Whatever is showing in the data field set is what will be exported into the CSV file. If you want to change the field set view to add or reduce fields for your export you can refer back to Day 3 of "The 21 Day Aspen Challenge". Once your field set view is all set simply click on the printer icon located to the top, right-hand side of your browser window. Illustration 3 shows the icon.
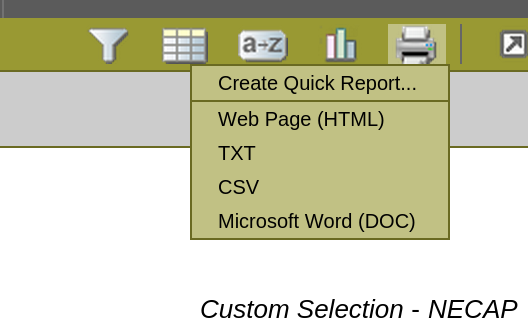 |
| Illustration 3: Exporting to CSV |
 |
| Illustration 4: Chromebook File Manager |
Importing the CSV File into Google Spreadsheets
The WWPS uses Chrome as our supported browser, and many of our staff use Chromebooks as their school department computer. The following set of instructions illustrates how to import the CSV file into Google Spreadsheets. WWPS users should go to their Google Drive, and select the folder where they would like to import the file. I have a subfolder labeled 2013-2014 NECAP Data that sits within a larger Data folder. I am going to import or upload the QR_677307155347372458.csv file into the 2013-2014 NECAP Data folder. The QR_XXXXX file name is automatically generated by Aspen and refers to a Quick Report file. Illustration 5 shows the initial steps to upload the file into your Google Drive.
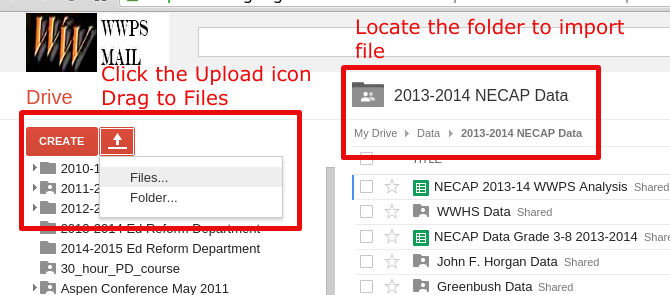 |
| Illustration 5: Import CSV into Selected Google Drive Folder |
Once you've clicked the Upload Files option you will need to locate the CSV. In this example I am locating the QR_677307155347372458.csv file within my Download Manager on my Chromebook. Illustration 6 displays that process.
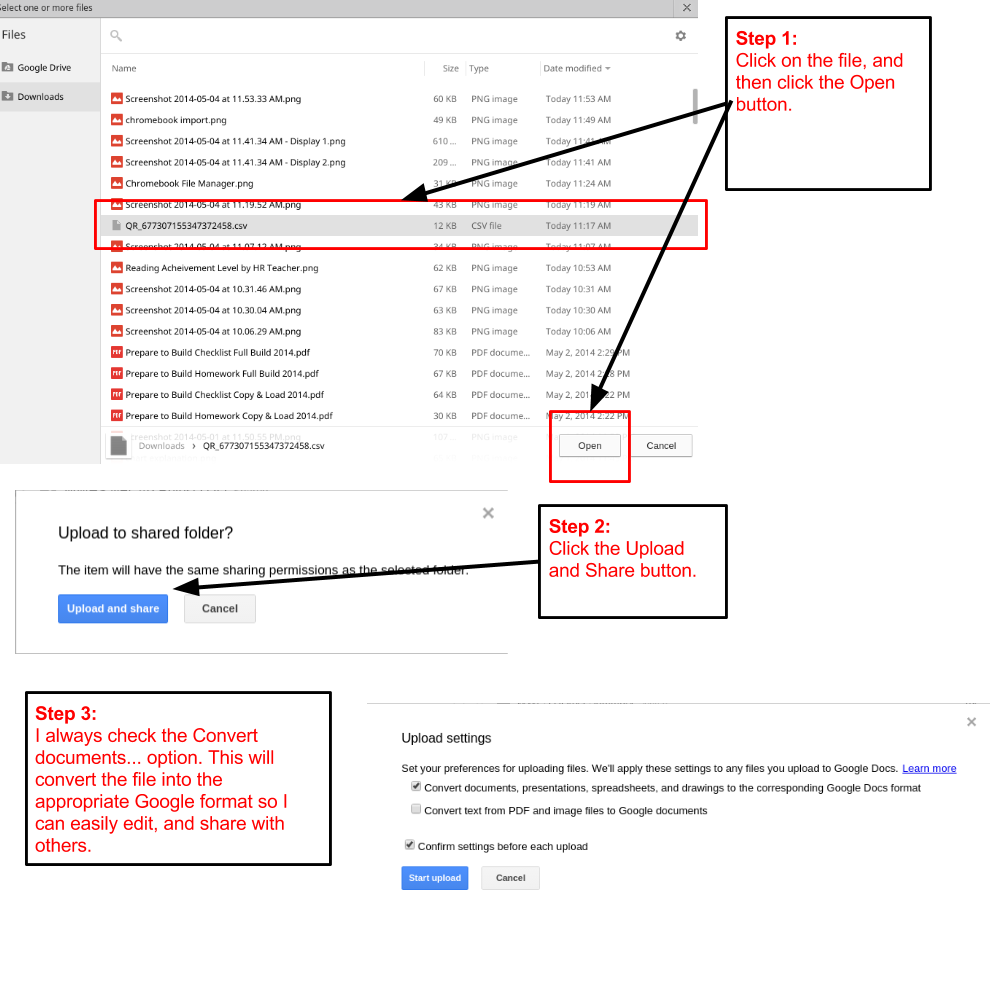 |
| Illustration 6: The 3 Step CSV to Google Spreadsheet Process |
Once you've finished the 3 Step CSV to Google Spreadsheet process you'll be able to open your exported data in Google Spreadsheet for further analysis and sharing. Illustration 7 displays the data in a Google Spreadsheet. If you would like to know more about using Google Drive. You can view Paul Barrette's 21 Day Google Drive Challenge.
 |
| Illustration 7: Reviewing the Data in Google Spreadsheets |
The Final Word
Exporting your field set data into a CSV file is extremely powerful tool within Aspen. I hope that Day 5 of the 21 Day Aspen Challenge is helpful to you as a teacher, administrator or support personnel. Let me know what you'd like me to dig deeper into regarding exporting data from Aspen.
No comments:
Post a Comment